in this activity we were tasked to perform image segmentation on images. image segmentation is used to isolate relevant parts of an image, parts that are needed to be extracted for useful information.
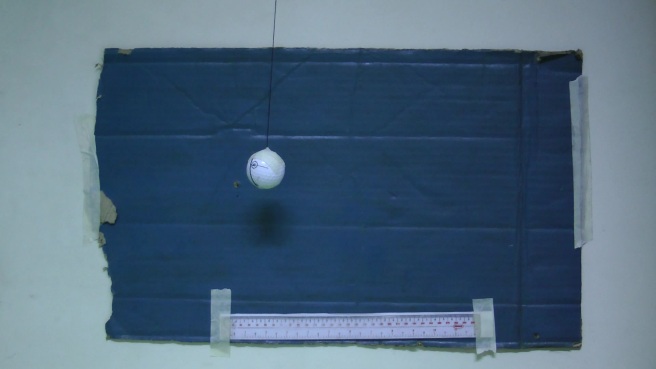
the first task is to segment the letters of a grayscale image shown below:

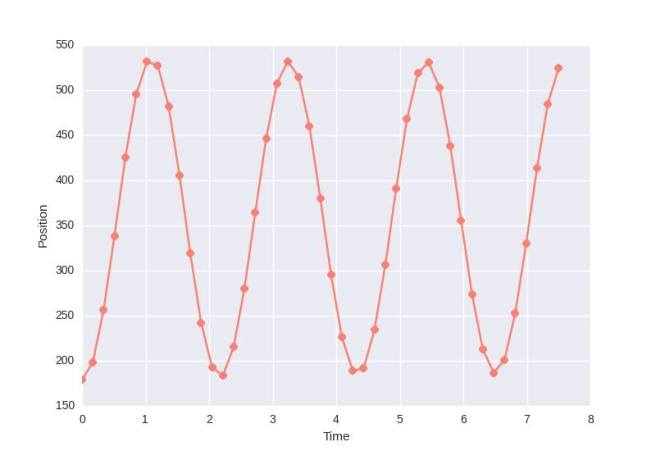
a histogram was made, showing the pixel number vs the intensity value. it shows how frequent a particular pixel value comes up inside an image.

judging from this histogram one can deduce that the relevant pixels have intensities between 160 and 210. i used two thresholds, 160 and 180, to eliminate pixels below 160, and also pixels above 180. the resulting image is shown below.

then we were talked to isolate objects from an RGB image. there are two kinds of segmentation based on color: parametric, and non-parametric segmentation. parametric segmentation extracts objects that fall under a certain probability, which is determined by an extracted cropped template. the product of the probabilities in red and green space (blue is not necessary, since it is just a linear combination of red and green) is the joint probability. if a pixel falls into that joint probability, then it is considered more or less the same color.
below is a frame from a UAAP basketball game between Far Eastern University and De La Salle University.
a patch was extracted from a green-jerseyed player (see blue square above), and a patch was extracted, shown below:

and below are shown the resulting mask, and the extracted objects from the original image.


non-parametric segmentation on the other hand requires one to make a 2D-histogram, which shows the position of the color values in an r-g space. if the value of the pixel falls inside that position, then it can be considered the same color.
below is the histogram used:

and below are the mask, and the extracted objects.