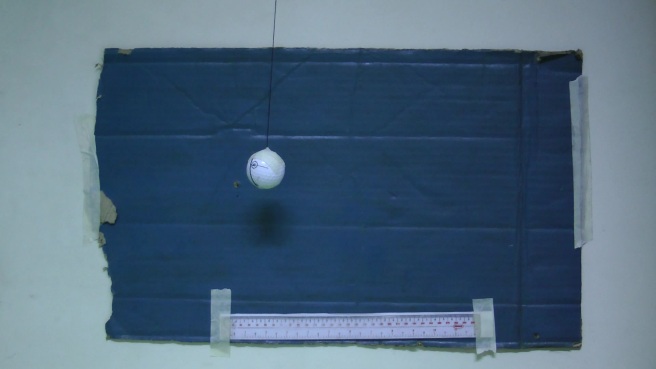
in this activity our group (Ariel Canete, Jessica Nasayao, and Jeremy Hilado) decided to measure the period of a pendulum hanging on a string measuring 90cm. different ROI’s taken from different frames were converted into 2D histograms that were combined and used to segment the pendulum. the following are the ROI’s used for the experiment, and the combined 2D histogram:


the frames used for processing were taken 10 frames apart from the original video.
after isolating the pendulum, and performing morphological operations, the following .gif file was made, showing the segmented pendulum:

getting the x-centroid (from using the function regionprops) of the ball for each frame resulted to this graph:
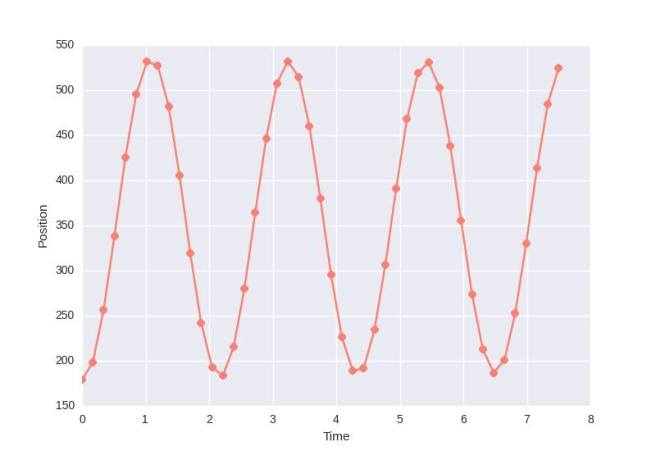
the graph show that the period of the ball lasted 2.1 s. comparing that to the calculated period of the ball [T = 2pi*sqrt(L/g)], which is 1.9 s, the percent error was at 10%.
